5 Essential Technical Indicators Every Stock Trader Should Know
Introduction to Technical Analysis
Technical analysis is an essential skill for any stock trader aiming to understand market trends, forecast price movements, and make informed trading decisions. Unlike fundamental analysis, which looks at the intrinsic value of a stock, technical analysis focuses on price action, volume, and patterns. Technical indicators, in particular, help traders evaluate past price data to predict future performance. In this blog, we’ll dive into five essential technical indicators every trader should know and how Stocknotif can integrate these indicators into daily trading alerts for smarter buy/sell decisions.
1. Moving Average (MA)
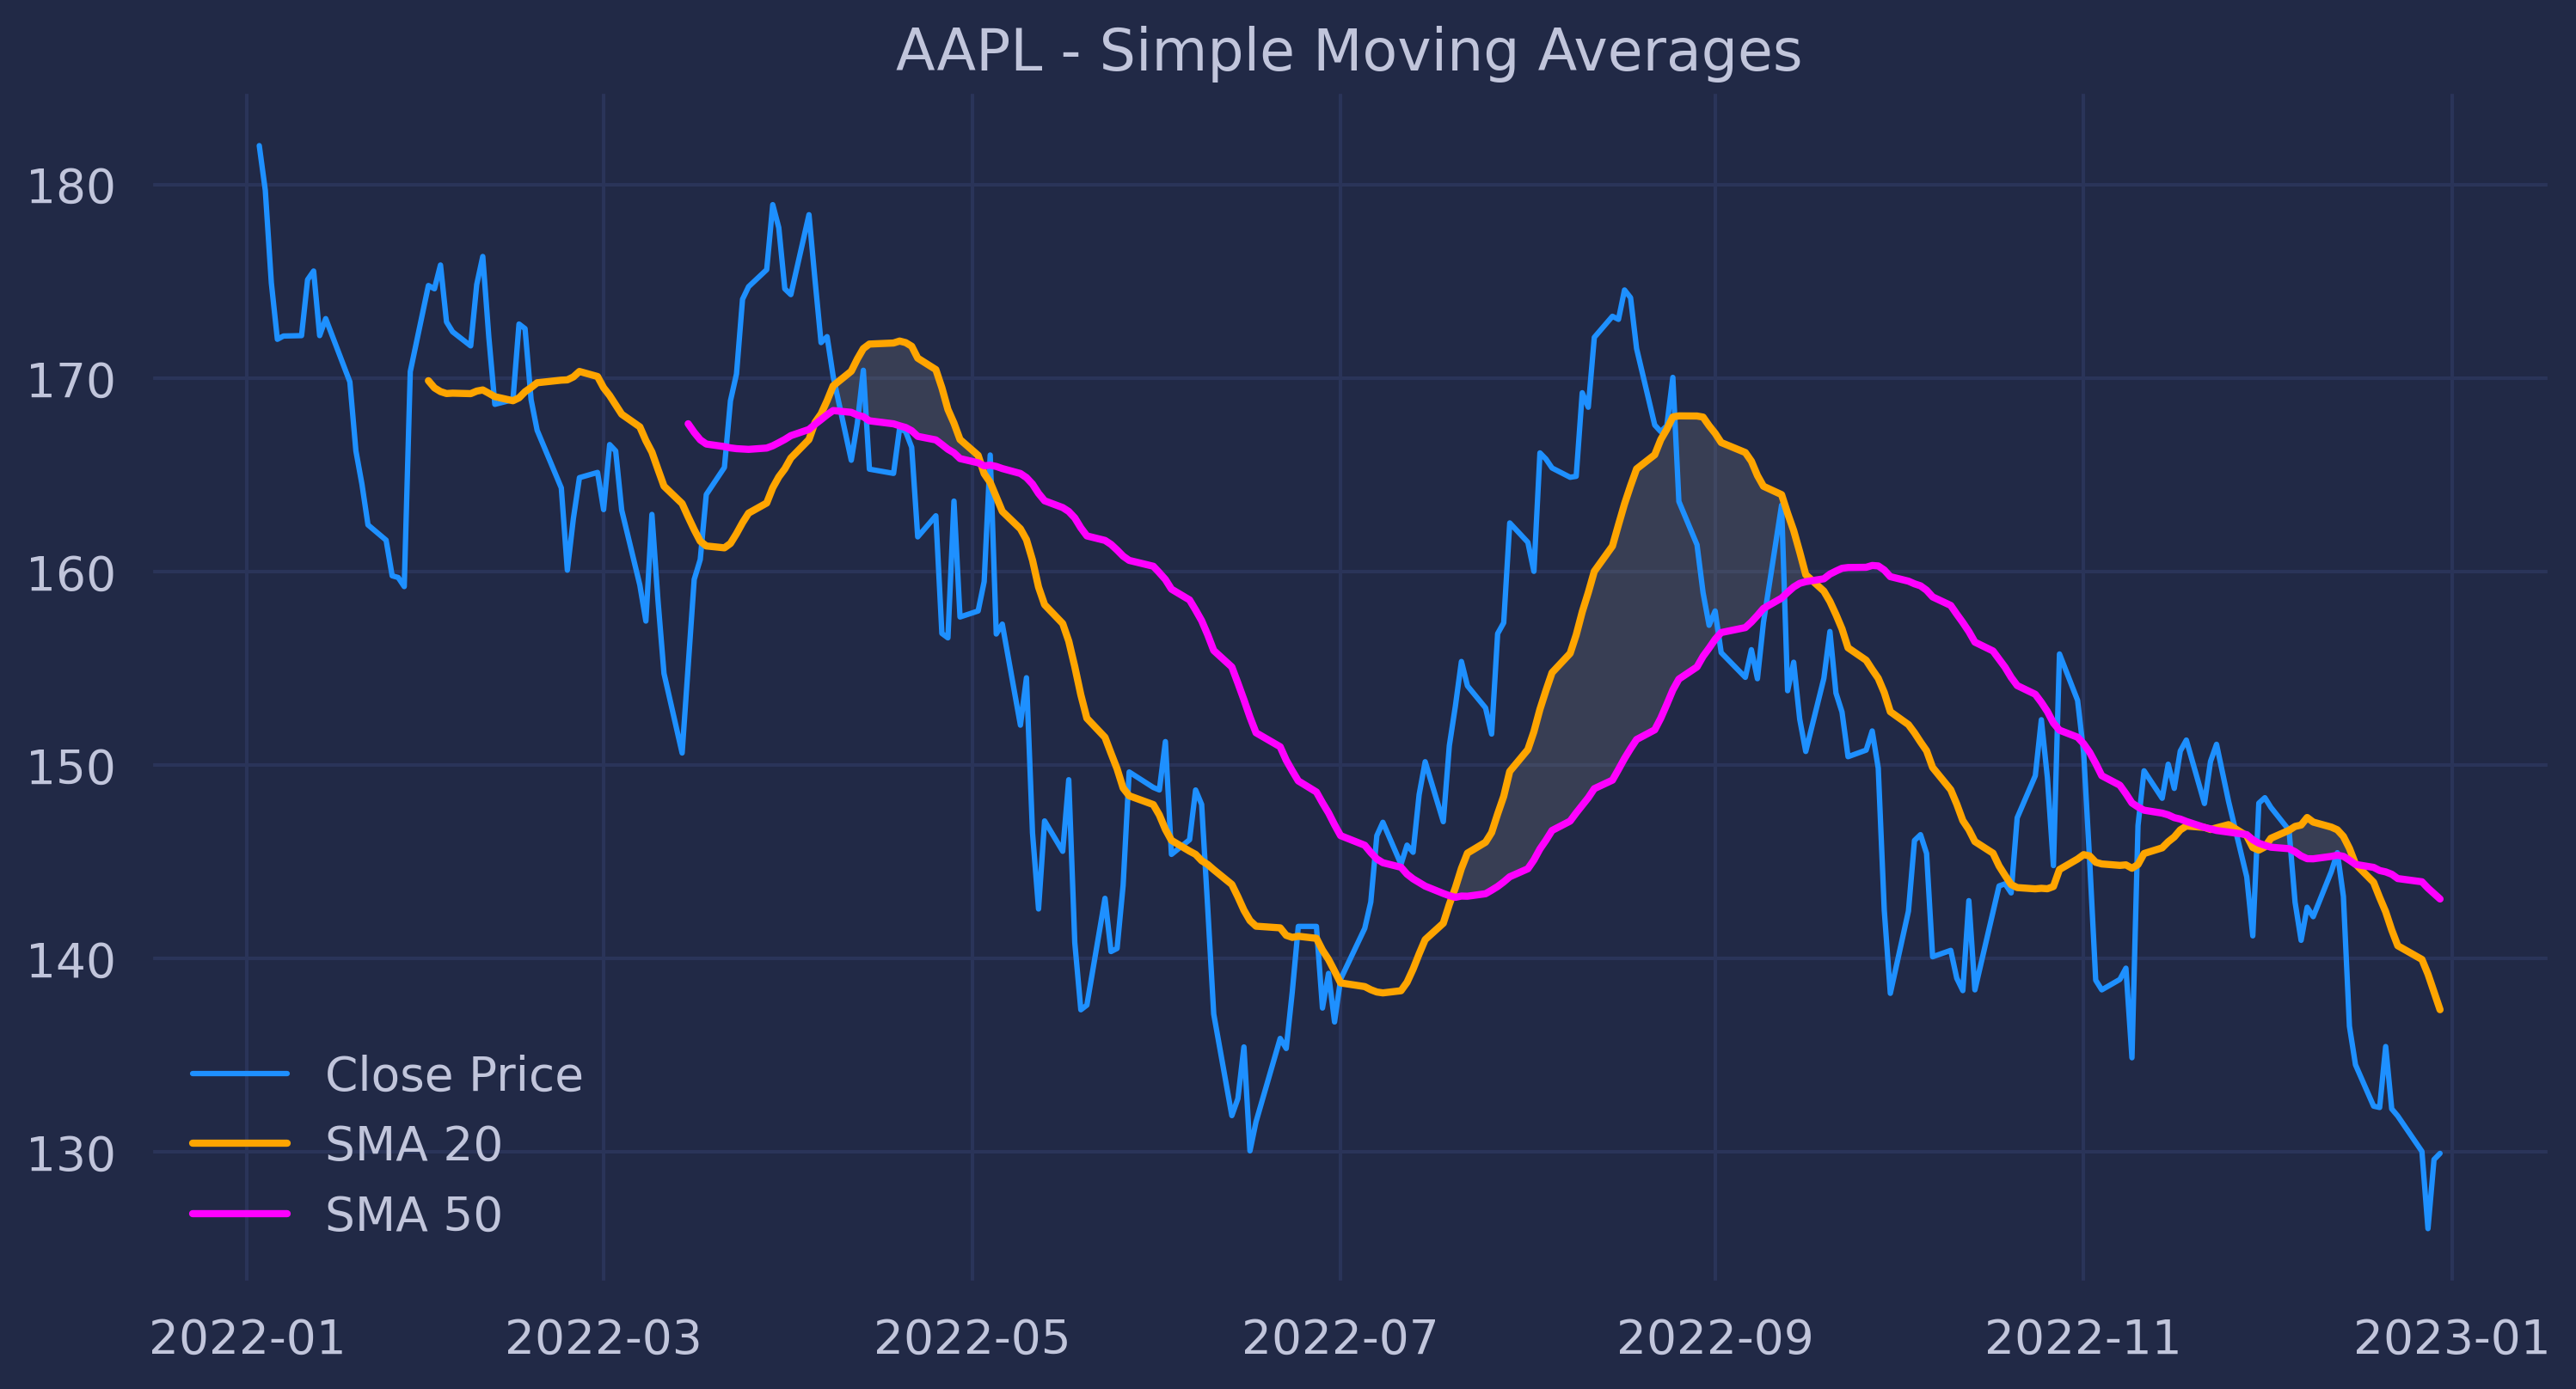
A Moving Average (MA) smooths out price data to create a single flowing line, which helps identify the overall trend direction of a stock.
Simple Moving Average (SMA) Formula:
$$ SMA = \frac{P_1 + P_2 + \dots + P_n}{n} $$
Where:
- ( P ) is the price at each period
- ( n ) is the number of periods
Traders use the SMA to filter out noise and see the long-term trend of a stock. A short-term SMA (e.g., 20-day) can be compared to a long-term SMA (e.g., 200-day) to generate buy or sell signals when they cross.
How Stocknotif Helps:
Stocknotif uses moving averages to send notifications when key moving averages cross, signaling a potential trend reversal or breakout.
2. Relative Strength Index (RSI)
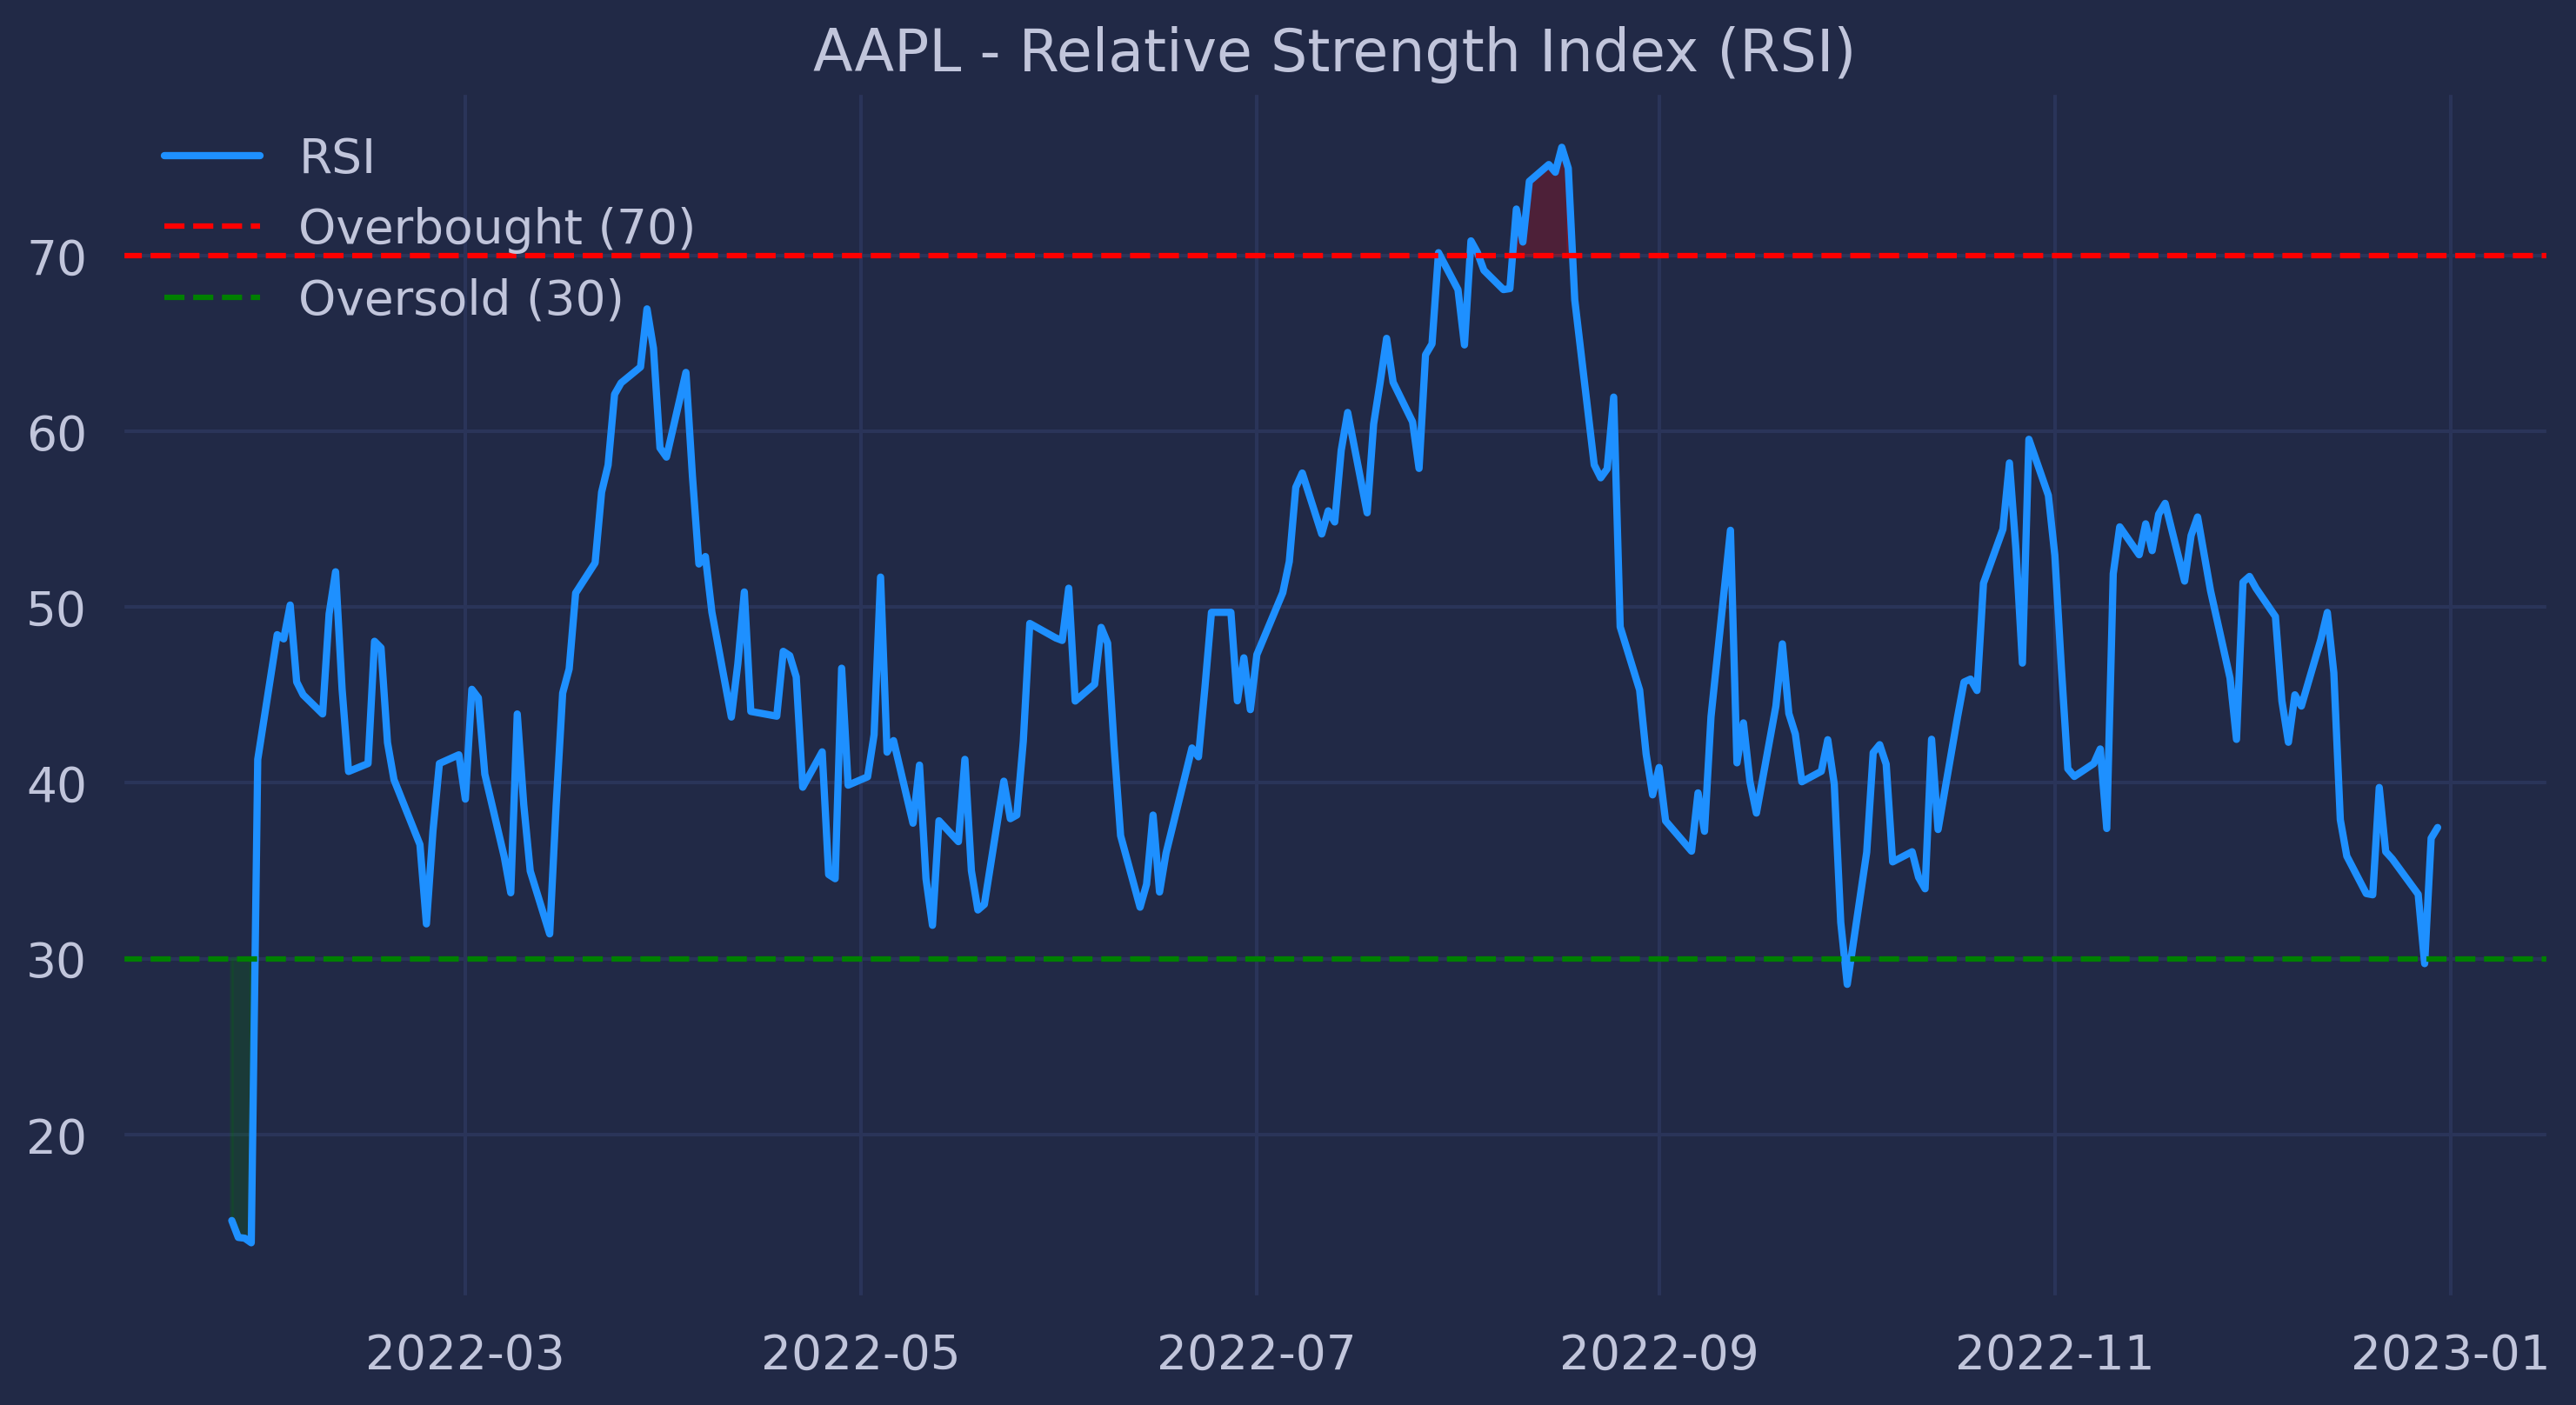
The Relative Strength Index (RSI) measures the magnitude of recent price changes to assess whether a stock is overbought or oversold.
RSI Formula:
$$ RSI = 100 - \left( \frac{100}{1 + \frac{\text{Average Gain}}{\text{Average Loss}}} \right) $$
The RSI ranges from 0 to 100:
- An RSI above 70 typically indicates a stock is overbought.
- An RSI below 30 suggests the stock is oversold.
How Stocknotif Helps:
By tracking RSI levels, Stocknotif alerts traders when stocks reach overbought or oversold conditions, providing opportunities to capitalize on potential price corrections.
3. Moving Average Convergence Divergence (MACD)
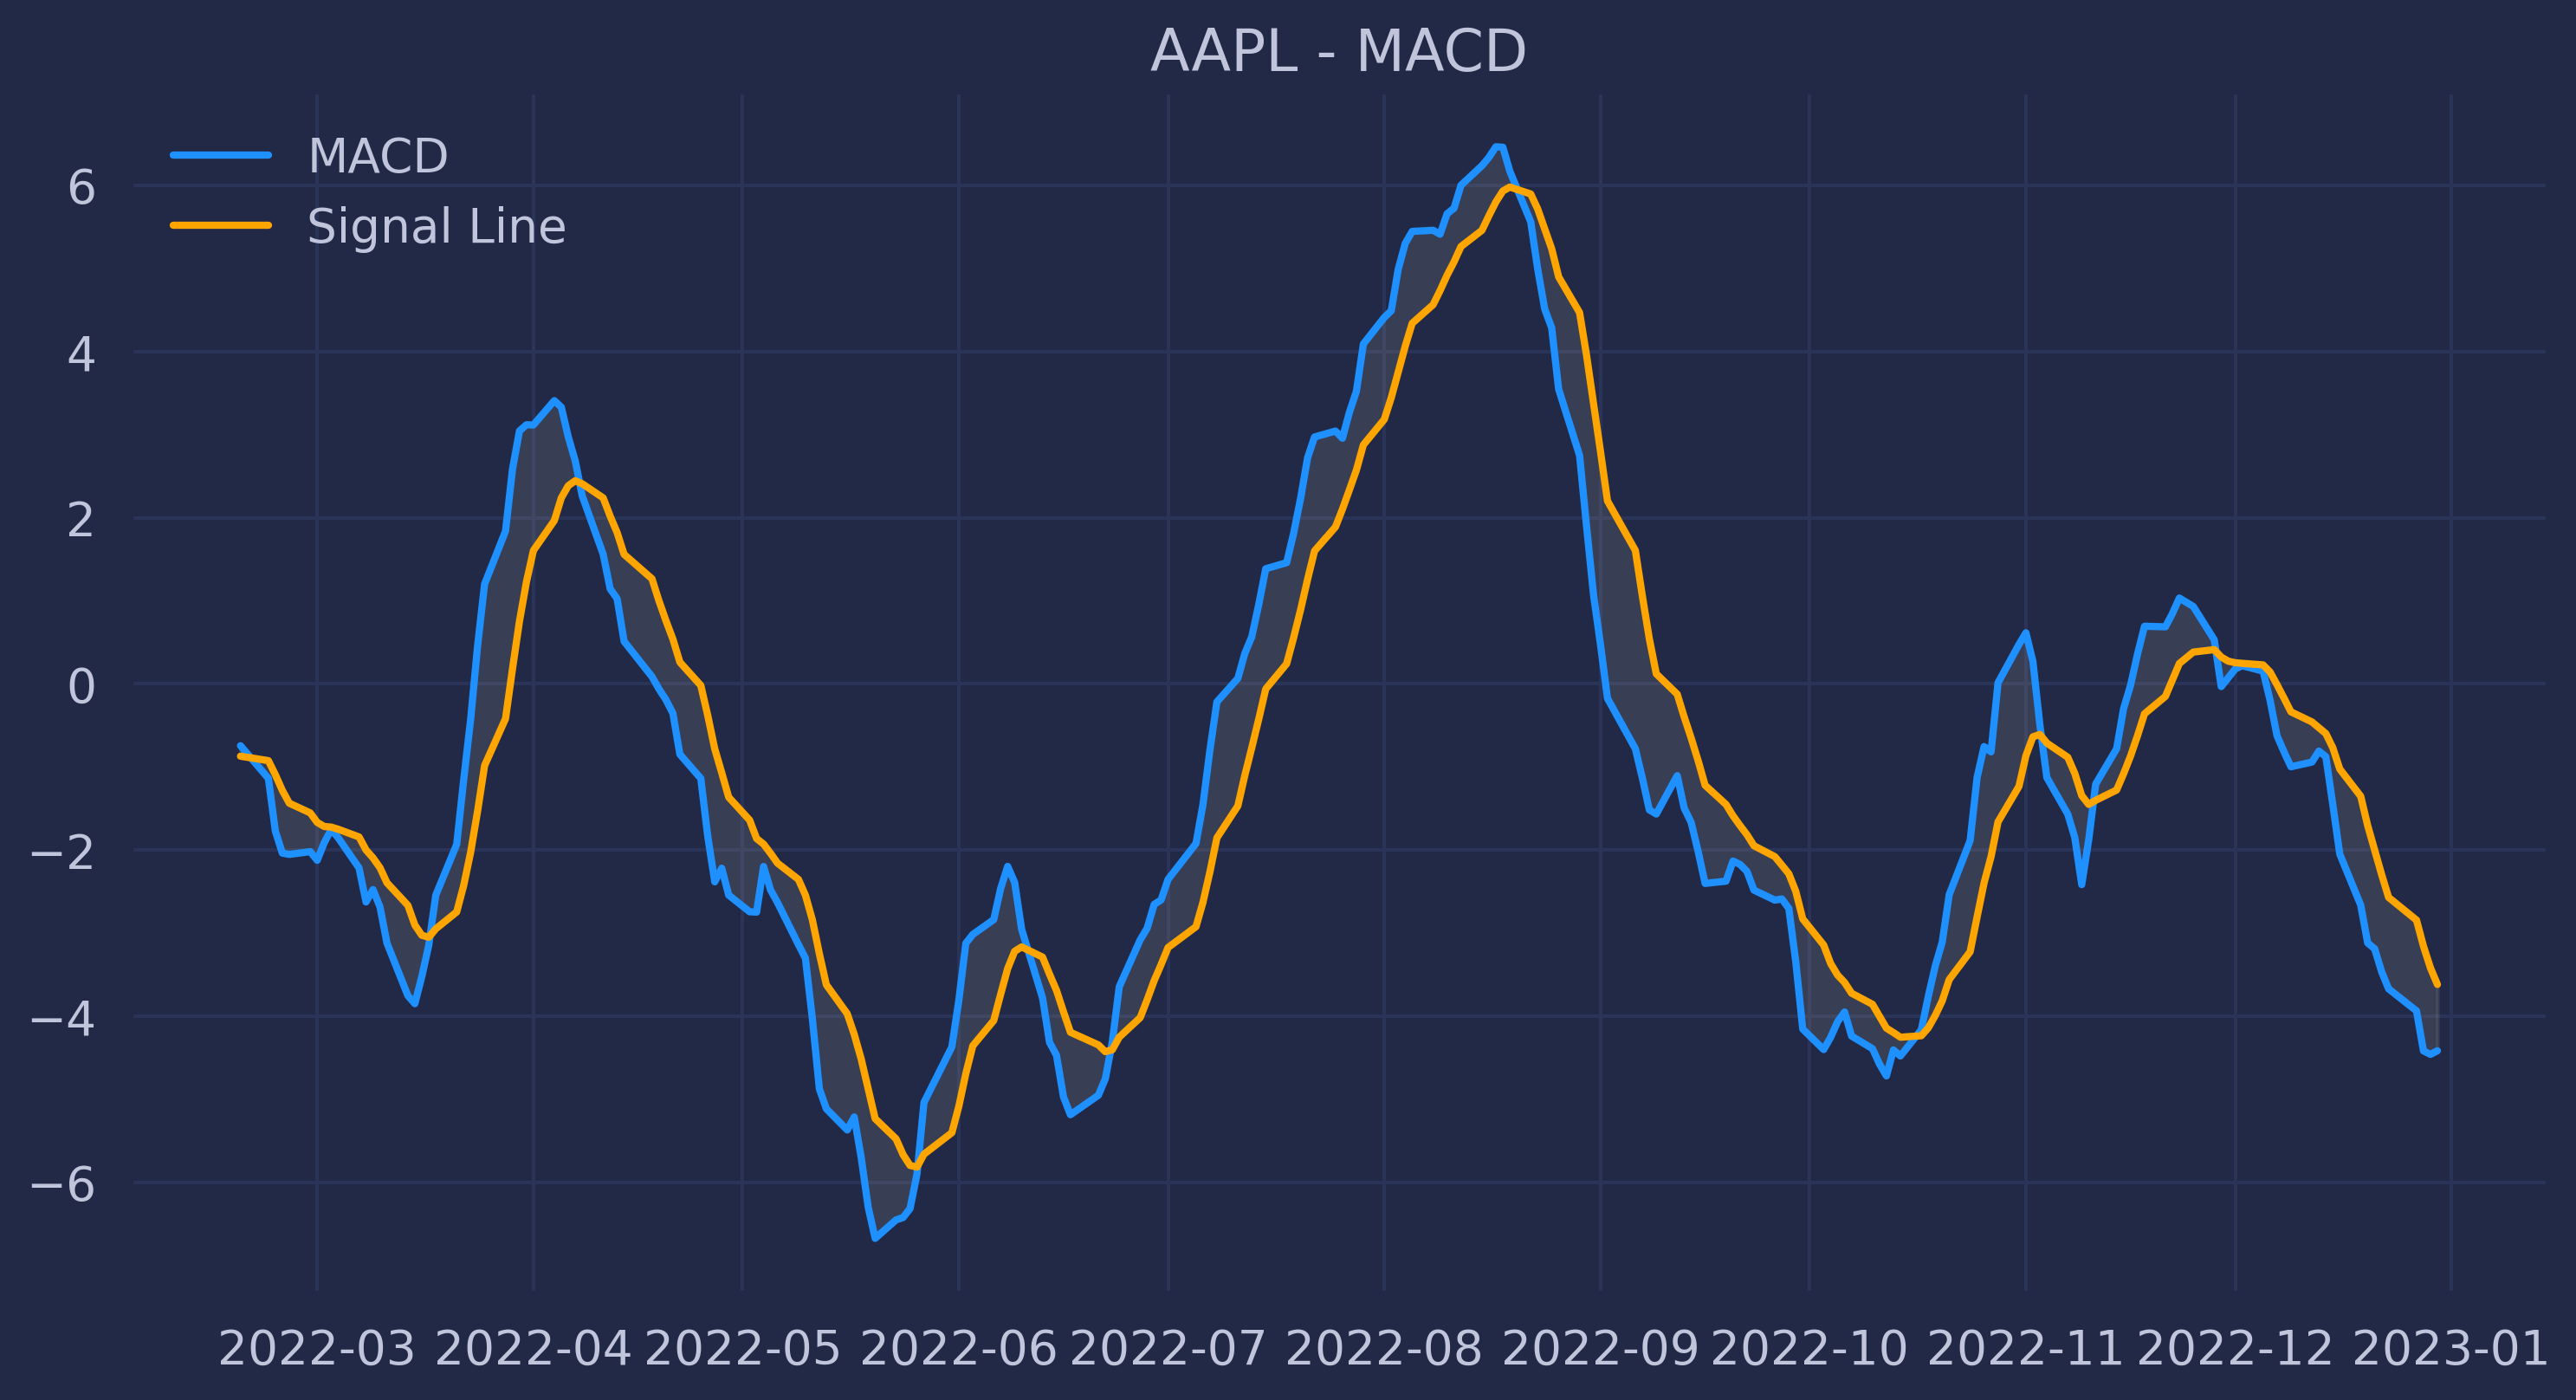
The MACD is a trend-following momentum indicator that shows the relationship between two moving averages of a stock’s price.
MACD Formula:
$$ MACD = EMA(12) - EMA(26) $$
Where:
- ( EMA ) is the Exponential Moving Average
The MACD line is typically used alongside a signal line (9-day EMA). When the MACD crosses above the signal line, it suggests a bullish trend, while a cross below signals a bearish trend.
How Stocknotif Helps:
Stocknotif integrates MACD signals to help traders stay ahead of market movements, notifying them when MACD crossovers occur.
4. Bollinger Bands
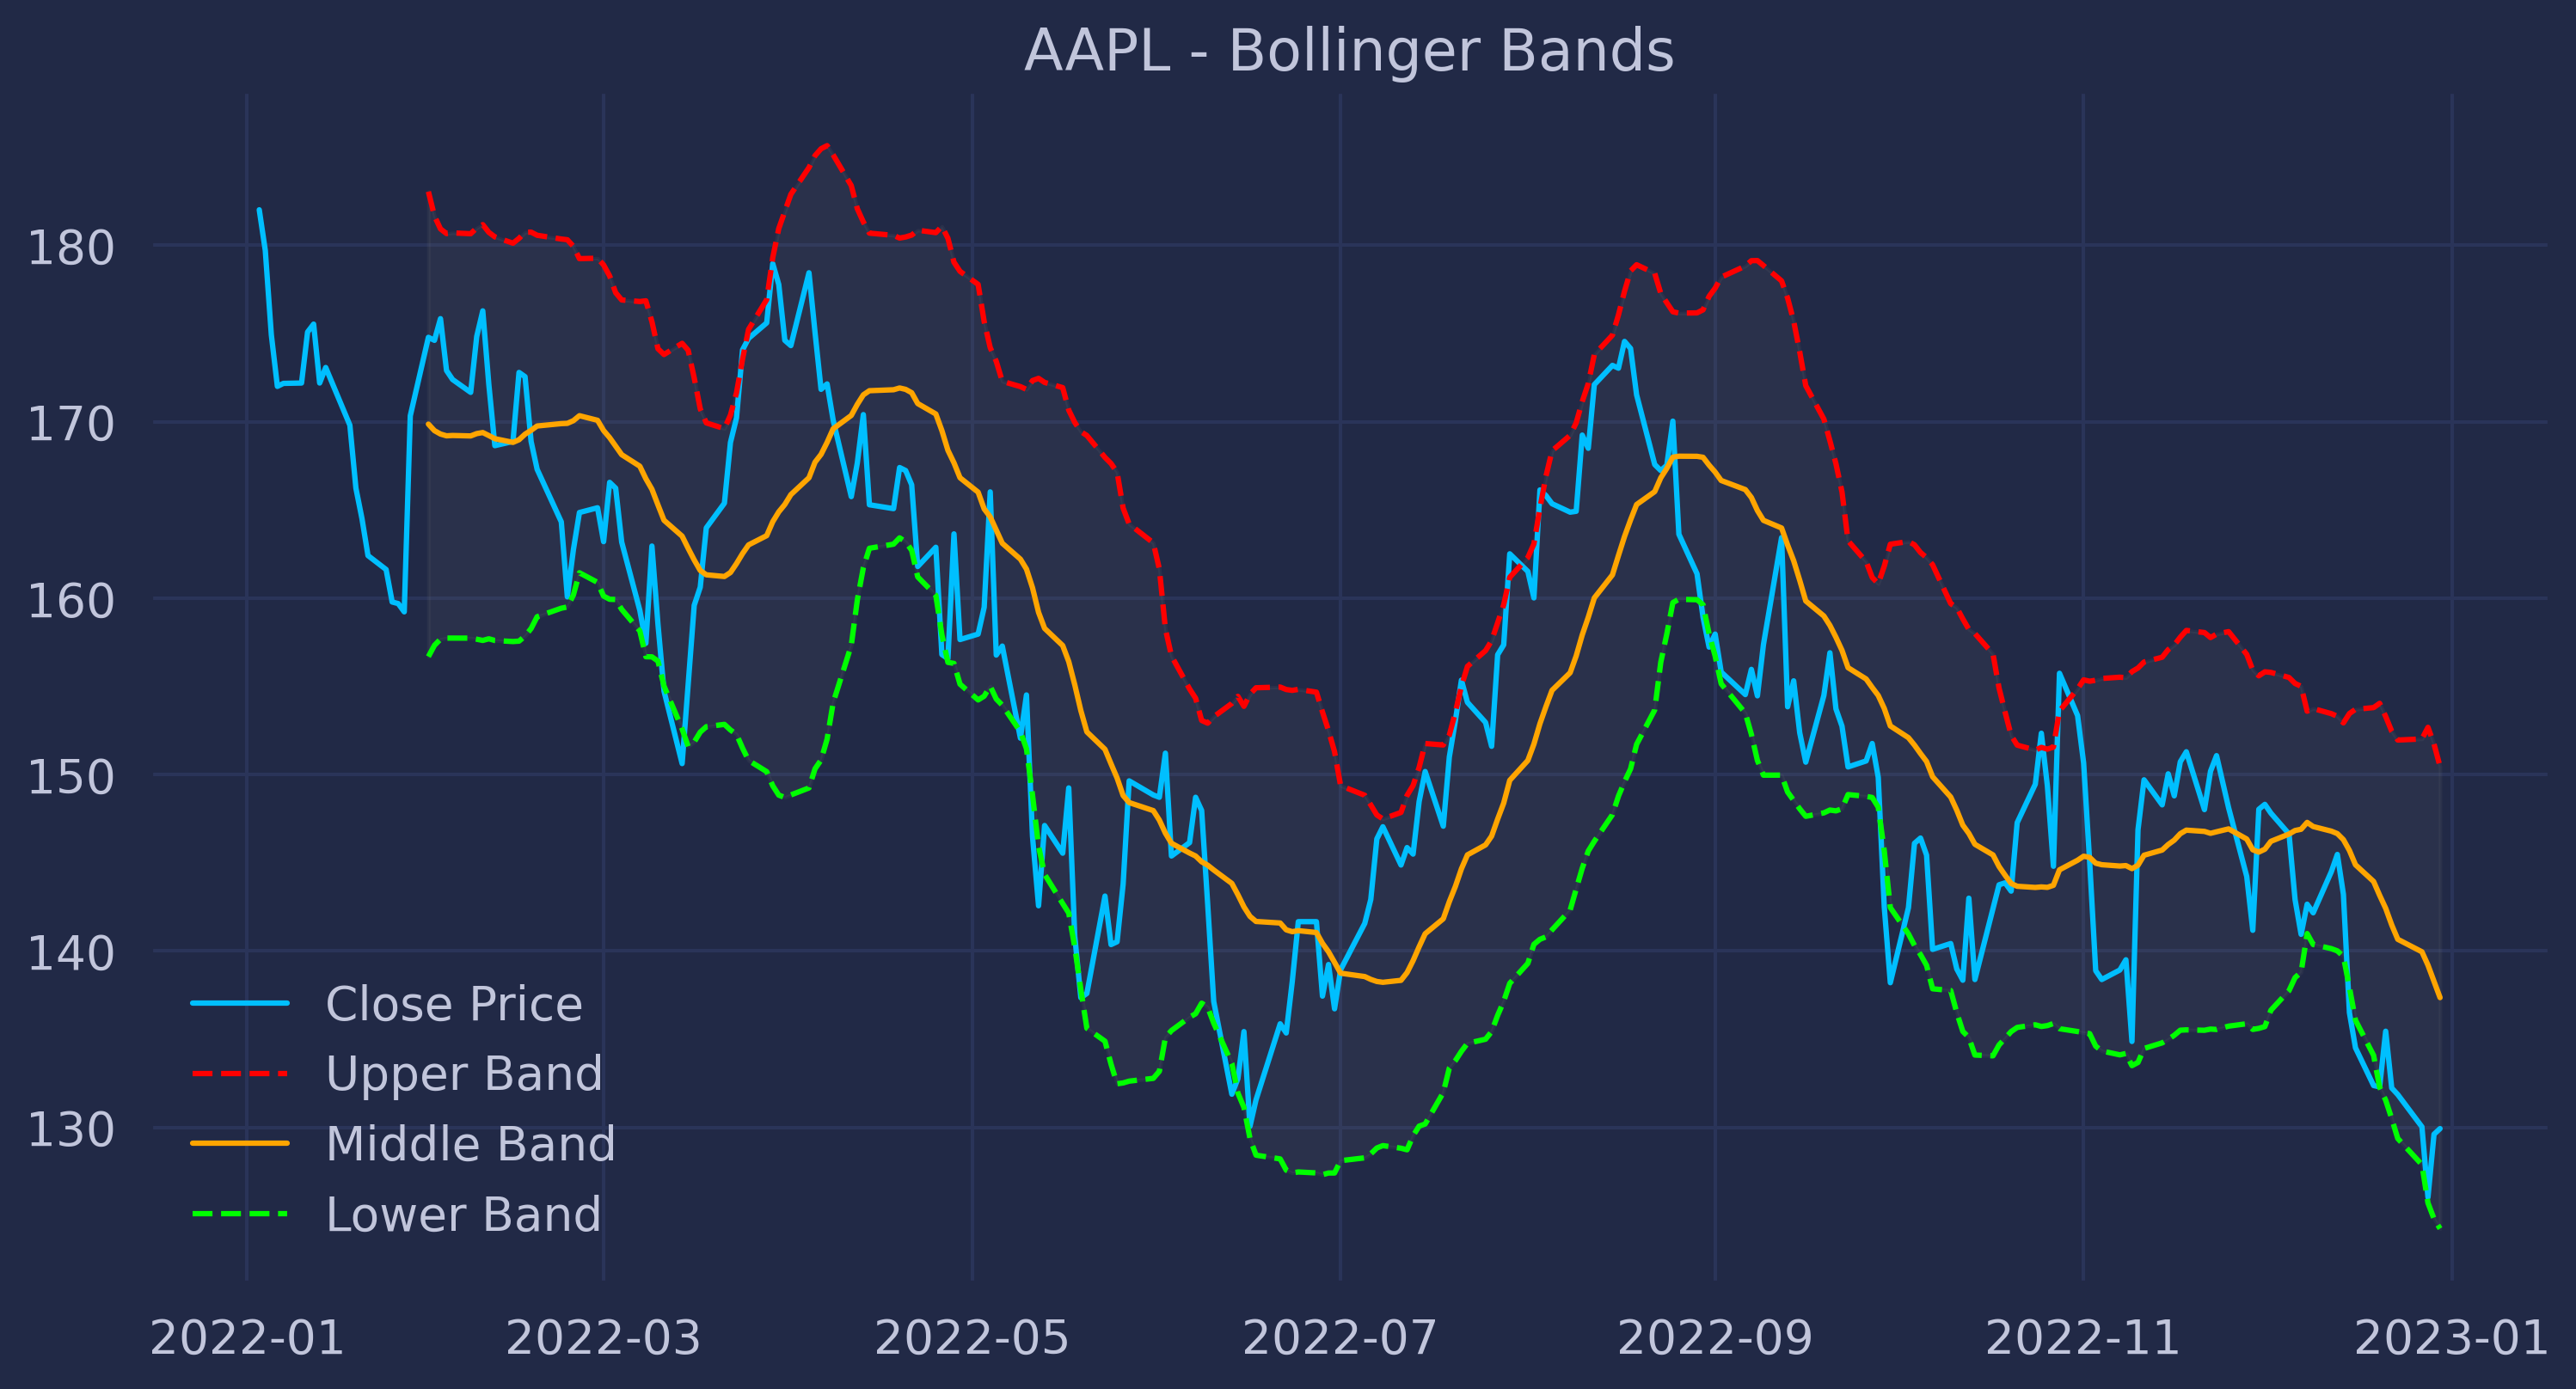
Bollinger Bands consist of a middle band (SMA) and two outer bands that represent standard deviations of the price.
Bollinger Bands Formula:
$$ \text{Upper Band} = SMA + (2 \times \sigma) $$ $$ \text{Lower Band} = SMA - (2 \times \sigma) $$
Where:
- $\sigma$ is the standard deviation of the price.
Bollinger Bands help identify volatility in the market. When the bands tighten, volatility is low, and when they widen, volatility is high.
How Stocknotif Helps:
Stocknotif monitors Bollinger Bands and sends alerts when prices touch or breach the outer bands, signaling potential breakout or breakdown opportunities.
5. Stochastic Oscillator
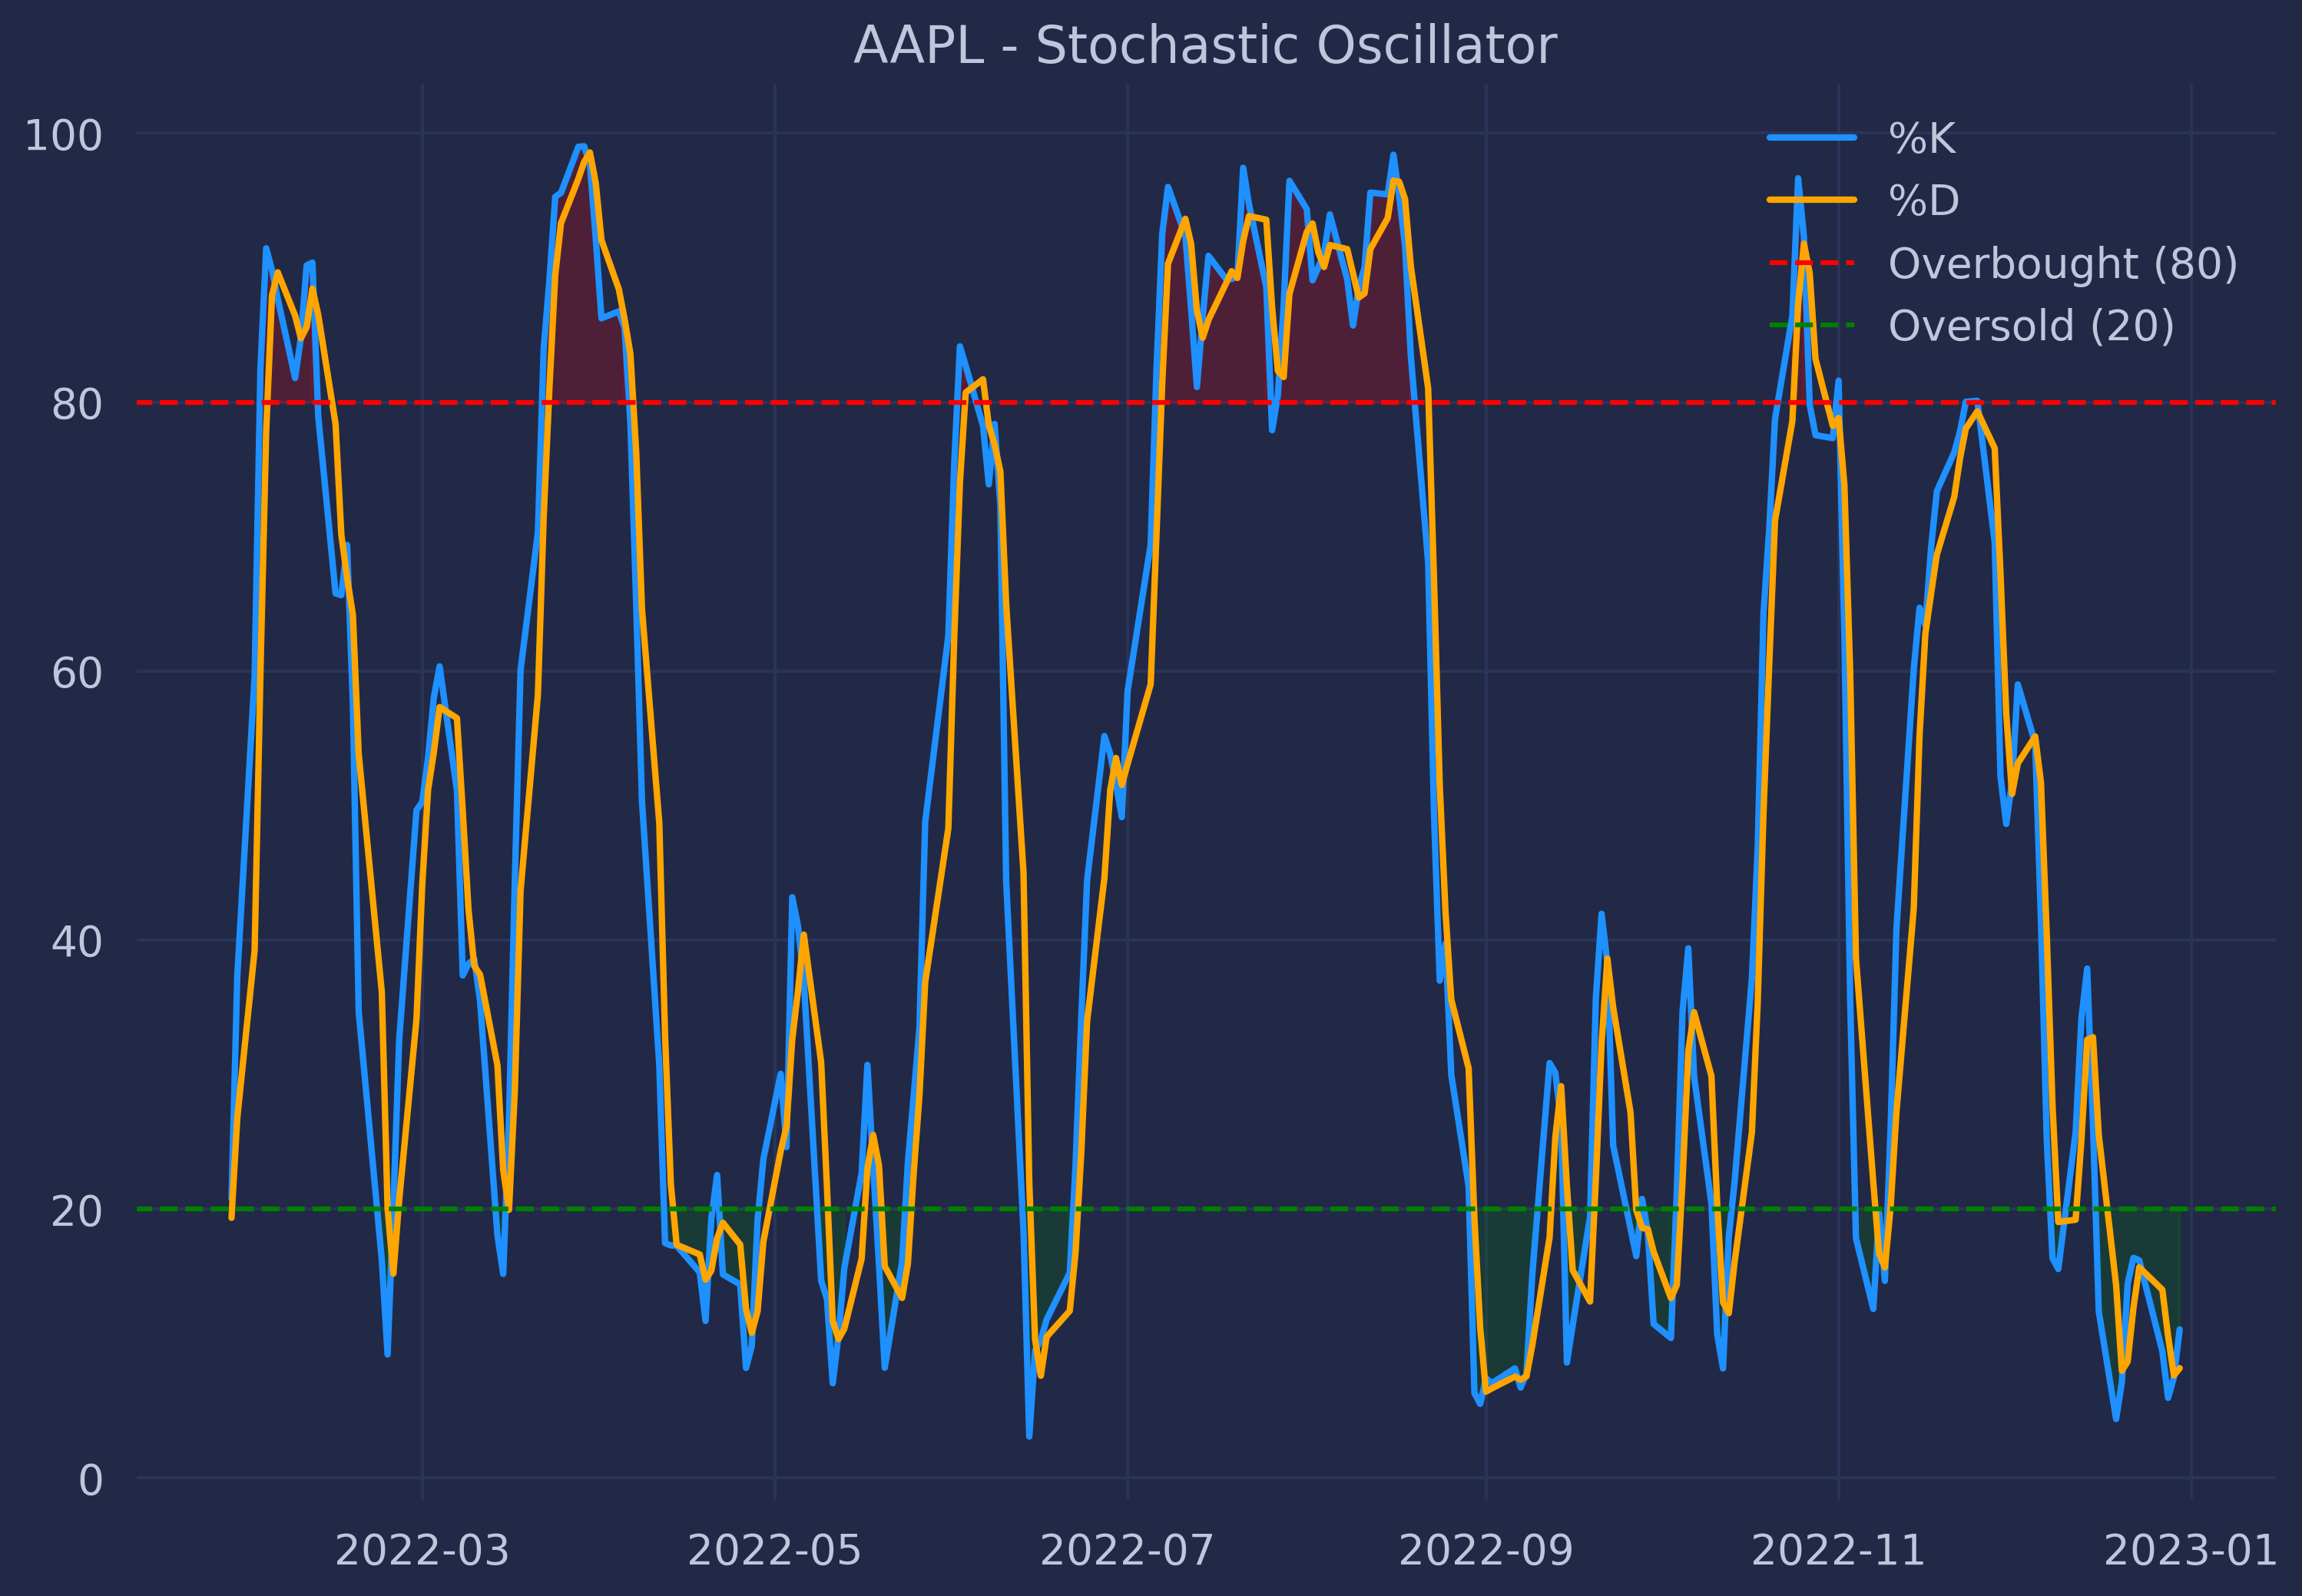
The Stochastic Oscillator is a momentum indicator comparing a stock’s closing price to its price range over a specific period.
Stochastic Oscillator Formula:
$$ %K = \frac{\text{Current Close} - \text{Lowest Low}}{\text{Highest High} - \text{Lowest Low}} \times 100 $$
The %K line is the main line, while the %D line is a moving average of %K. Traders use crossovers of these lines to determine bullish or bearish trends.
How Stocknotif Helps:
Stocknotif tracks the Stochastic Oscillator, alerting traders when %K crosses above or below %D, signaling potential buying or selling opportunities.
Conclusion: Empower Your Trading with Stocknotif
Understanding and utilizing these technical indicators can significantly improve your trading strategy. Whether you’re looking to identify trends, assess momentum, or pinpoint market volatility, Stocknotif integrates these indicators into its daily trading alerts, helping you make better-informed decisions.
By delivering alerts for indicators like SMA, RSI, MACD, Bollinger Bands, and the Stochastic Oscillator, Stocknotif ensures that you never miss a key market signal.
Start using Stocknotif today and take your trading to the next level. Add Stocknotif on Telegram or learn more about our features.
Disclaimer: The information provided is for educational purposes only and should not be considered as financial advice.